NRDC’s “Drought Report Card” Gets an “Incomplete”
NRDC’s “Drought Report Card” gets an “incomplete” for using a flawed report as the basis of its poor grade for agriculture. NRDC’s 2014 report, “The Untapped Potential of California’s Water Supply: Efficiency, Reuse, and Stormwater,” cowritten with the Pacific Institute, was used as the basis for its recent “report card.”
Old Data
Much of the agricultural section of its 2014 report is actually based on a 2009 Pacific Institute Report. At the time, the Pacific Institute estimated that 3.4 million acre-feet of water savings were attainable through improved irrigation scheduling. That number was based on a 1997 DWR survey of just 55 farmers who claimed a 13 percent savings in applied water by incorporating CIMIS data into irrigation scheduling. The Pacific Institute also assumed back in the 2009 report that only 20 percent of farmers were using some sort of irrigation scheduling, so it applied the 13 percent savings to the remaining 80 percent in each of California’s hydrologic basins to arrive at its 3.4 MAF number. That’s quite a stretch.
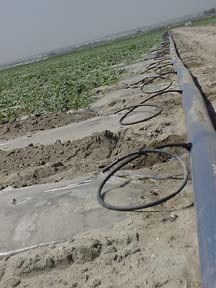
A much better benchmark for agricultural water savings took place a year later. In 2010 the Agricultural Water ManagementCouncil also surveyed farmers about water use efficiency. The AWMC survey included 414 farmers statewide and found that 57 percent used CIMIS data or an irrigation consultant to schedule their irrigation.
Yet today, 15 years after DWR’s small survey of 55 farmers, we see reports like this using the same tired and speculative numbers to justify criticism of agricultural water use efficiency.
Cherry Picking
NRDC and the Pacific Institute were happy to cite estimates from DWR in a 2013 report that said applied water might be higher in agriculture than previously thought (California Simulation of Evapotranspiration of Applied Water and Agricultural Energy Use in California PDF). At the same time they ignored DWR’s assessment elsewhere in the report about evolving cropping patterns in California toward higher-value crops and high-efficiency irrigation. DWR stated, “As a result of these trends in irrigation methods, the adoption and usage of ET information for scheduling has increased considerably.
At the same time they ignored DWR’s assessment elsewhere in the report about evolving cropping patterns in California toward higher-value crops and high-efficiency irrigation. DWR stated, “As a result of these trends in irrigation methods, the adoption and usage of ET information for scheduling has increased considerably.
The CalFed Bay-Delta Program assessment, mentioned in the 2014 NRDC/Pacific Institute report, uses DWR’s “Projection Level 6” (PL-6), or the maximum possible investment in water use efficiency to attain 4.3 million acre-feet in water savings. DWR’s estimated cost for that was $1.6 billion per year.
Unrealistic Estimates
In the 2009 California Water Plan Update, DWR stated, “Projection Level 6 is “unrealistic” and “impractical.” The Department went on to say, “Projection Level 6 represents a perfect irrigation system and management performance not attainable in production agriculture.” The CalFed Bay-Delta Program’s 2006 Comprehensive Evaluation also said that Projection Level 6 “…was intended to serve as a reference point, or bookend, to evaluate other projection levels and should not be part of the planning document.”
The CalFed Bay-Delta Program’s 2006 Comprehensive Evaluation also said that Projection Level 6 “…was intended to serve as a reference point, or bookend, to evaluate other projection levels and should not be part of the planning document.”
Yet the Pacific Institute’s reported Ag Water Conservation and Efficiency Potential takes CalFed’s PL-6 even further and applies a 100 percent efficiency level, rather than CalFed’s more realistic 70 percent level. Only by stretching the CalFed numbers and applying them to 100 percent of California’s agricultural land are they able to arrive at their grossly inflated 6.6 MAF estimate of conservation potential that NRDC used as the basis for its “report card.”
Rather than stretching the facts about agricultural water use, let’s let the public decide if water for food and fiber is a good deal.

